Quick Action Dashboard
The Quick Action Dashboard serves as a powerful tool designed to provide a clear and concise overview of your website’s performance. Built with the needs of e-commerce and content-driven platforms in mind, this dashboard delivers actionable insights that empower businesses to optimize strategies, improve user experience, and drive impactful results.
Whether you aim to refine marketing campaigns, improve website functionality, or better understand user preferences, the Quick Action Dashboard simplifies decision-making by presenting vital data in visually engaging and intuitive formats. By leveraging its insights, you can uncover emerging trends, identify user behavior patterns, and create personalized experiences that resonate with your audience.
With an emphasis on visual representations such as pie charts and graphs, the dashboard transforms complex metrics into easy-to-understand visuals. These insights are not just numbers—they are the foundation for making smarter, data-driven decisions that fuel growth and success.
Why Use the Quick Action Dashboard?
- Empower Decision-Making: The dashboard simplifies data interpretation, ensuring that business owners, marketers, and developers can easily identify actionable trends.
- Enhance User Experience: By understanding what users search for, visit, and engage with, you can optimize your website to better serve your audience, ensuring their journey is seamless and satisfying.
- Drive Conversions: Leverage key metrics to improve marketing strategies, optimize product placement, and refine content, ultimately boosting conversion rates and revenue.
- Save Time: With clear and organized visuals, the Quick Action Dashboard eliminates the need for extensive manual analysis, saving valuable time for your team.
Key Features
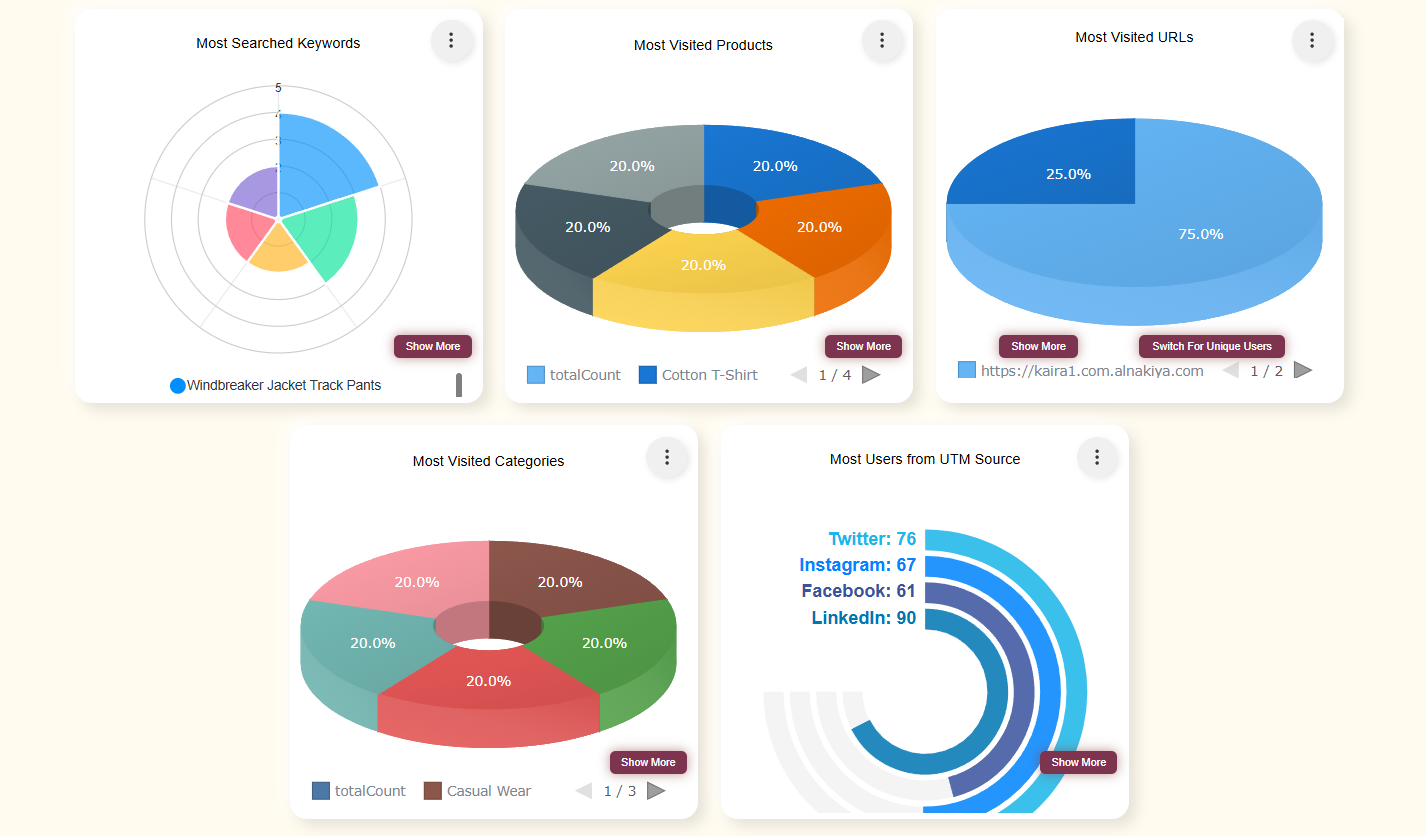
The dashboard focuses on presenting five critical metrics, each designed to shed light on your website’s performance. These metrics provide granular insights, helping businesses adapt strategies with precision.
1. Most Searched Keywords
Discover the top 5 keywords users search for on your website. These keywords reveal user intent and serve as a window into what your audience is actively looking for. By analyzing this data, you can align your offerings with user demands and gain a competitive edge.
- Uncover Trends: Spot emerging topics or popular products that are gaining traction among users.
- Optimize Search Functionality: Improve your website’s search capabilities to ensure users find exactly what they’re looking for.
- Plan Targeted Campaigns: Use trending keywords to design marketing campaigns that resonate with your audience.
2. Most Visited Products
Track the top 5 products that receive the most visits from users. This metric is a goldmine for e-commerce platforms, helping you identify your best-performing items.
- Highlight Popular Items: Feature these products prominently on your homepage or promotional banners.
- Manage Inventory Effectively: Avoid stockouts by prioritizing inventory for high-demand items.
- Understand Customer Preferences: Recognize seasonal trends or product preferences to fine-tune your product offerings.
3. Most Visited URLs
Analyze the top 5 URLs that attract the most traffic to your website. This data provides insights into user engagement and page performance.
- Optimize High-Traffic Pages: Fine-tune pages with high traffic to improve conversion rates or reduce bounce rates.
- Discover What Works: Identify the type of content, layout, or design that appeals most to your users.
- Enhance User Journey: Use insights to create a cohesive and intuitive navigation experience.
4. Most Visited Categories
Identify the top 5 categories that users frequently explore. For platforms offering a wide range of products or content, this metric is invaluable for organizing and promoting your offerings.
- Improve Navigation: Streamline your website’s navigation by placing popular categories front and center.
- Prioritize High-Engagement Categories: Focus resources on creating content or stocking products within these categories.
- Boost Marketing Efforts: Align ad campaigns with categories that attract the most user interest.
5. Most Users from UTM Sources
Understand where your users originate by tracking the top 5 UTM sources, such as social media platforms, email campaigns, or paid ads. This metric helps you gauge the effectiveness of your marketing channels.
- Optimize Marketing Budgets: Focus resources on channels that drive the most traffic and conversions.
- Tailor Content for Specific Platforms: Deliver customized content that aligns with the preferences of users from different sources.
- Measure Campaign Success: Monitor the ROI (Return on Investment) for specific campaigns.
Call to Action
The Quick Action Dashboard is not just a tool; it’s a gateway to understanding your audience better and making decisions that lead to success. Start leveraging its insights today to optimize your strategies, enhance user experiences, and achieve your business goals effortlessly.
Contact us to learn more about integrating the Quick Action Dashboard with your platform and unlocking the full potential of your website’s performance data.