DOM View Page
Explore the DOM structure of your web application during session replays to gain insights into user interactions and debug issues effectively.
Overview
The DOM View Page is a powerful tool that allows you to inspect the Document Object Model (DOM) during user session replays. This functionality is especially useful for debugging layout issues, analyzing interactions, and understanding how users experience your web application.
By providing an interactive DOM inspection feature, this tool enables developers to delve into the structural details of their web pages and diagnose problems efficiently.
Key Features
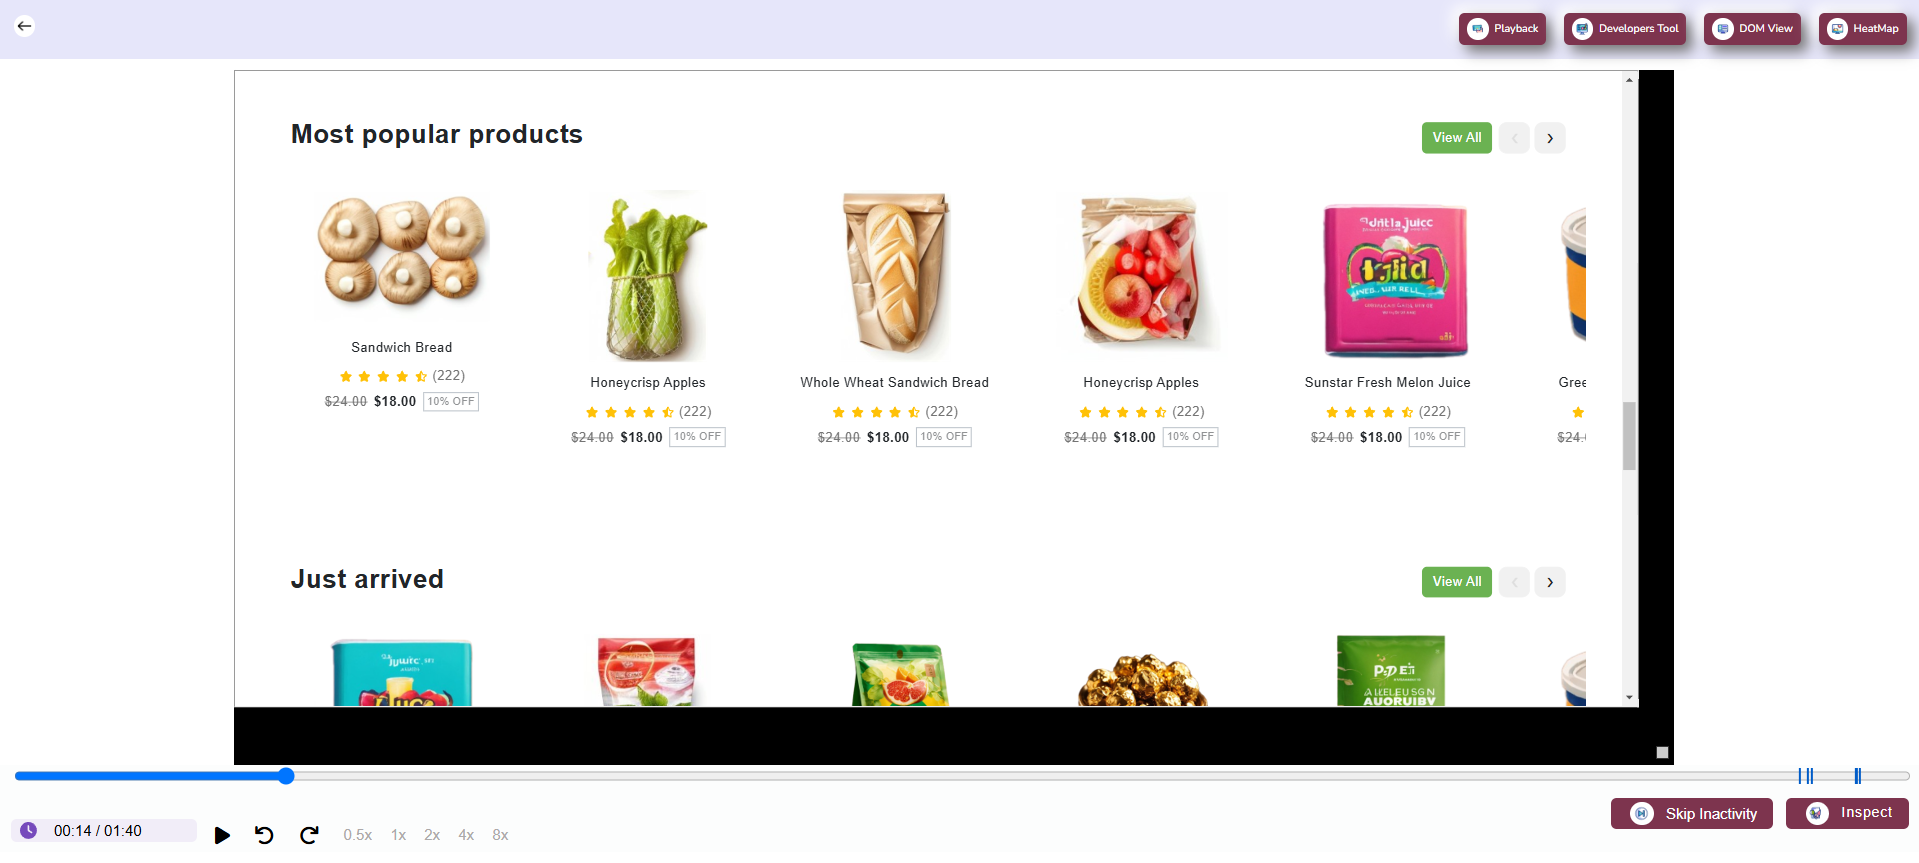
1. Session Replay
Replay user sessions to observe their interactions with your web page in real-time. Understand exactly how users navigate and interact with different elements.
- Pause, rewind, and fast-forward sessions to focus on specific moments.
- Identify patterns in user behavior and troubleshoot issues with precision.
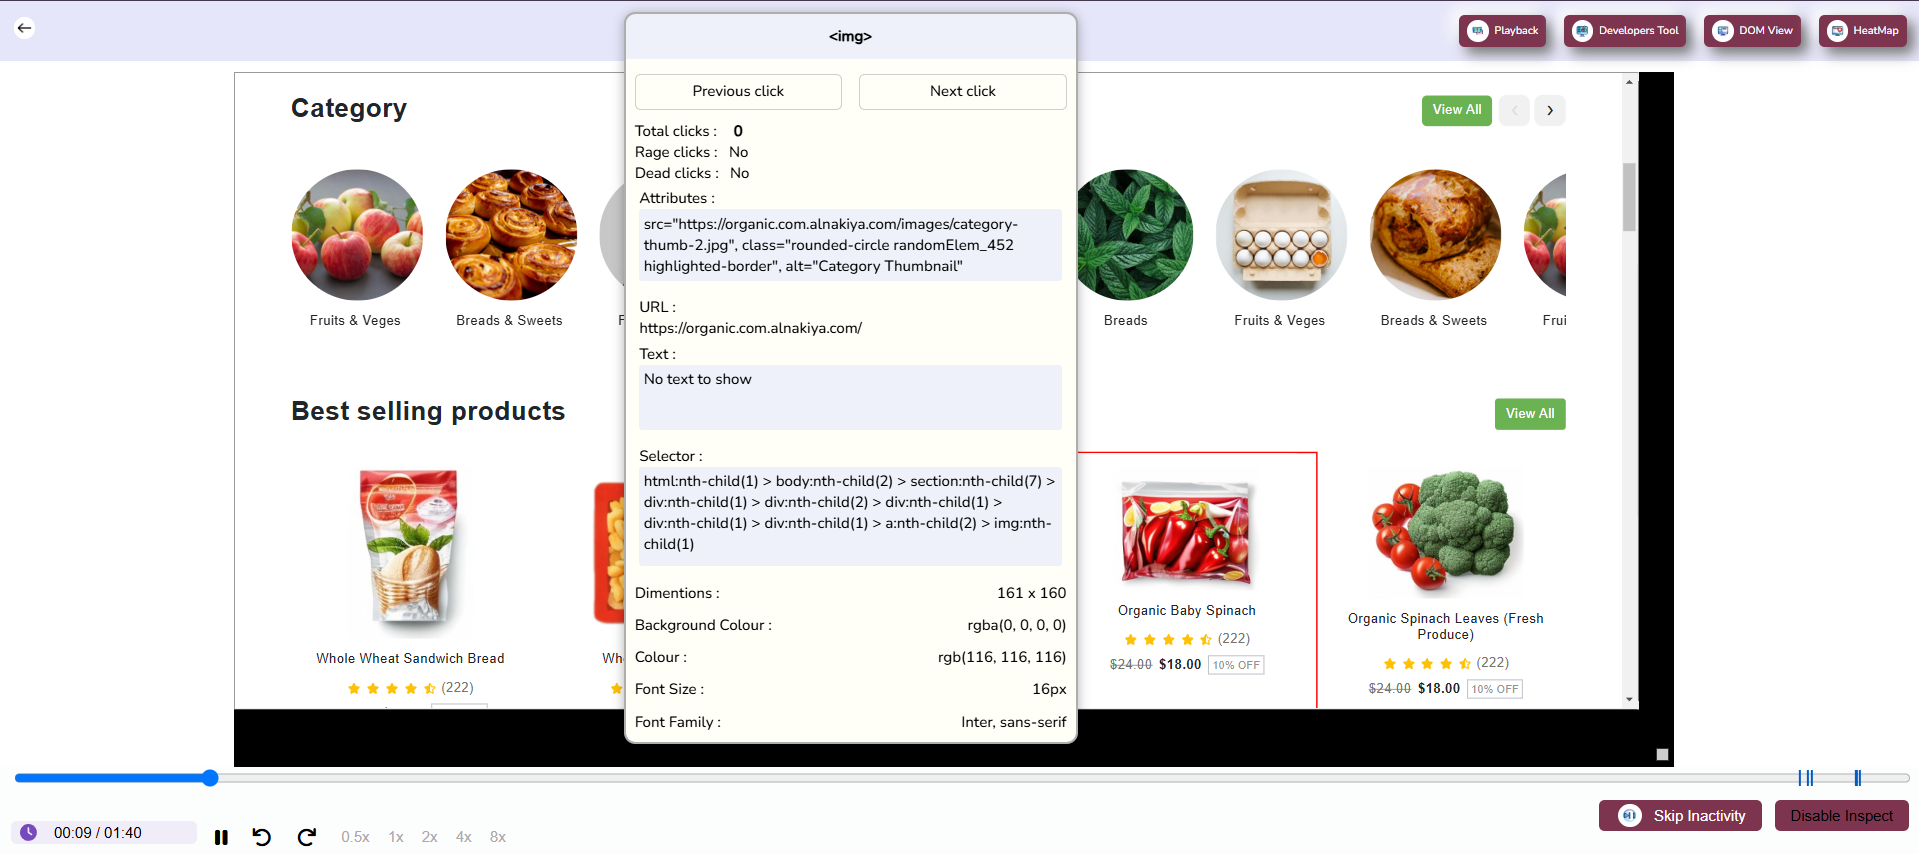
2. DOM Inspection
Pause the session replay and inspect the DOM at any point during the user's interaction. This feature provides detailed information about individual elements, including:
- CSS Styles: View the applied styles and inherited properties of elements.
- HTML Structure: Examine the hierarchy and relationships within the DOM tree.
- Attributes: Inspect attributes such as IDs, classes, and custom data properties.
- Interactive Highlighting: Hover over elements to highlight them in the replay view for easy identification.
3. Skip Inactivity
Enable the Skip Inactivity feature to automatically bypass idle periods during session replays. This allows you to focus only on active moments when users are interacting with your application.
- Save time by skipping over non-essential parts of the session.
- Efficiently debug and analyze user interactions.
How to Use the DOM View Page
Step 1: Replay a Session
Start by selecting a user session from the session list. Use the playback controls to observe the user's journey on your website.
Step 2: Pause and Inspect
Pause the session replay at any moment and click the Inspect button to analyze the DOM. You can hover over elements to see highlights or click them for detailed information.
Step 3: Skip Inactivity
Toggle the Skip Inactivity option to move through the session without watching idle moments. This is especially useful for sessions with extended periods of inactivity.
Use Cases
1. Debugging Layout Issues
Identify and resolve layout inconsistencies or design flaws by inspecting the DOM structure and applied styles of problematic elements.
2. Analyzing User Behavior
Gain insights into how users interact with specific elements on your web page. Use this information to improve usability and design.
3. Performance Optimization
Identify slow-loading or resource-intensive elements in the DOM and optimize them to enhance your page's performance.