Developers Tool Page
Access powerful tools for debugging, performance analysis, and session diagnostics to enhance user experience.
Overview
The Developers Tool Page serves as a central hub for analyzing the performance, network activity, and user interactions within your application. By using the tools provided, developers can monitor and troubleshoot issues effectively during live sessions. The insights gained here will help improve both the speed and functionality of your application, ensuring a smoother user experience.
This page includes detailed data on network requests, performance metrics, session sharing, and a direct link to the DOM inspection page. Whether you're debugging or optimizing, the Developers Tool Page is an essential asset for your workflow.
Key Features
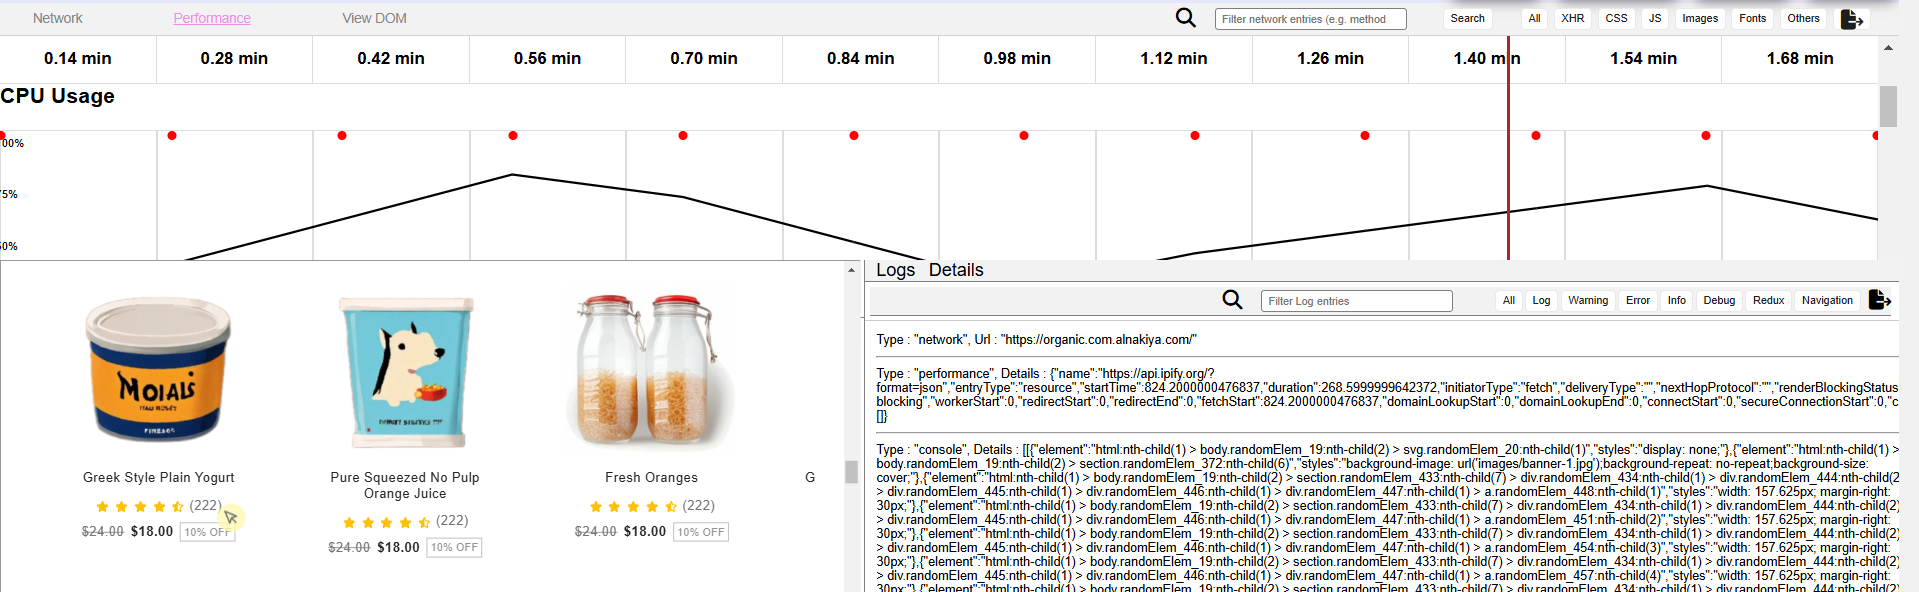
Network Information
Track all network activity in real time, including requests and responses, to identify issues like slow-loading resources, missing assets, or failed API calls. Understanding the network behavior allows you to pinpoint the root causes of performance problems and optimize accordingly.
Performance Metrics
These metrics give you a comprehensive view of how well your application performs during user sessions. Use the following performance indicators to fine-tune your app's responsiveness and loading speed:
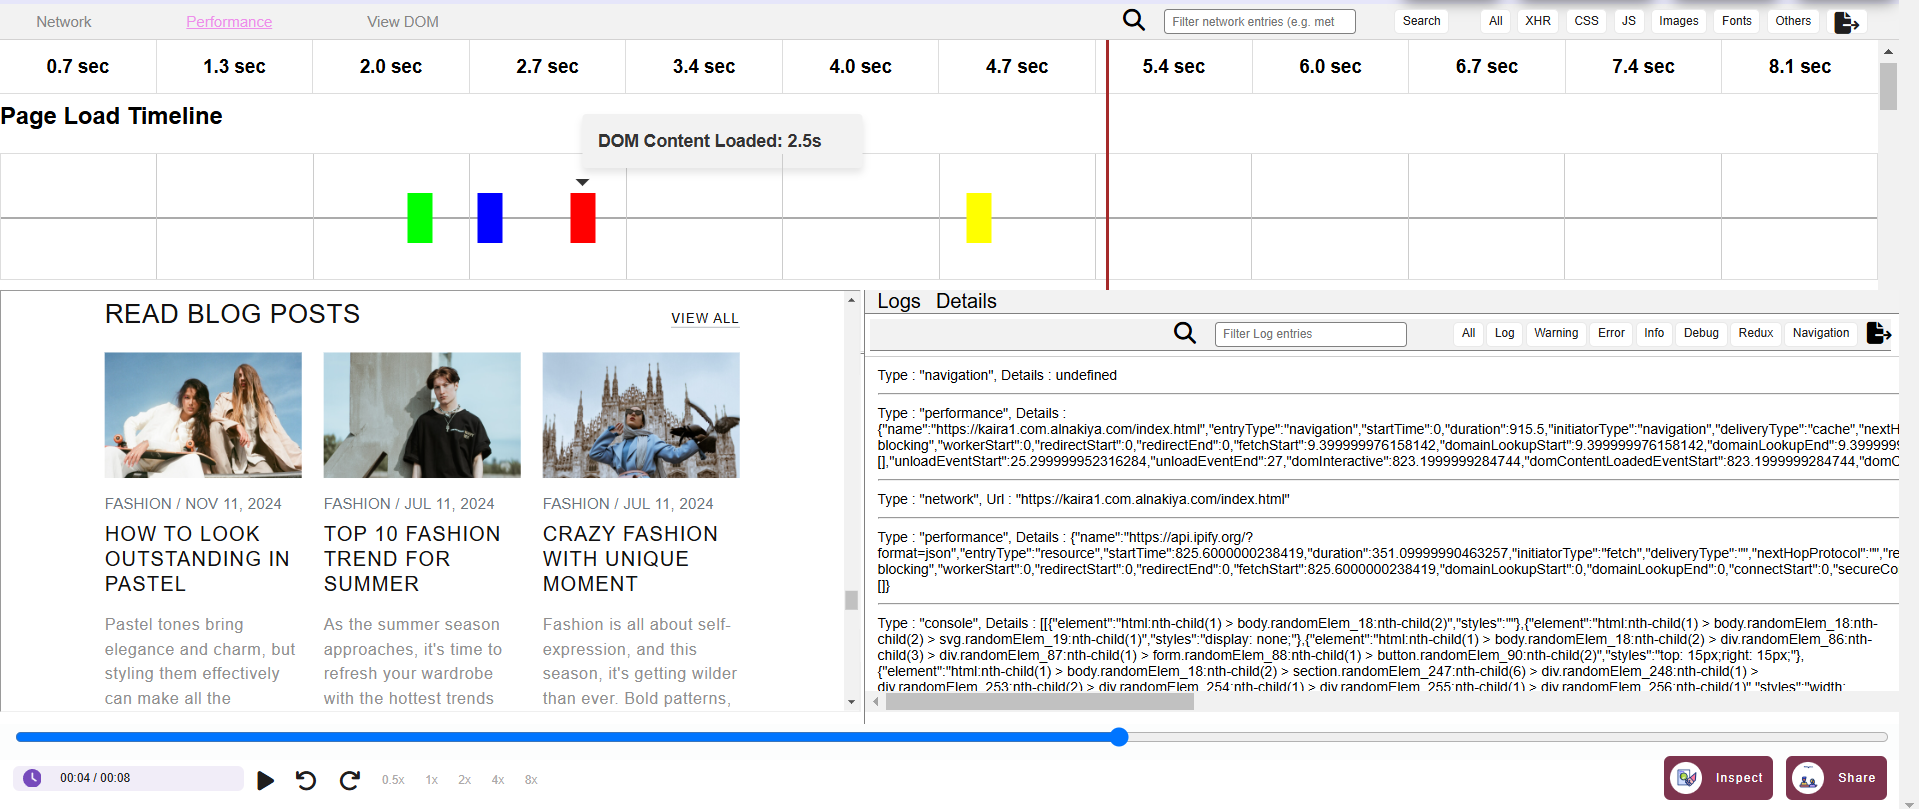
- Page Load Timeline:
This visual timeline breaks down the loading process into various stages, such as DNS resolution, content rendering, and final load. This view helps you identify bottlenecks in the loading process.
- Key Benefit: Pinpoint the stages in the loading process that take the longest time to complete.
- Actionable Insight: Focus on optimizing the server response times, reducing large file sizes, and utilizing Content Delivery Networks (CDNs) to distribute static resources faster.
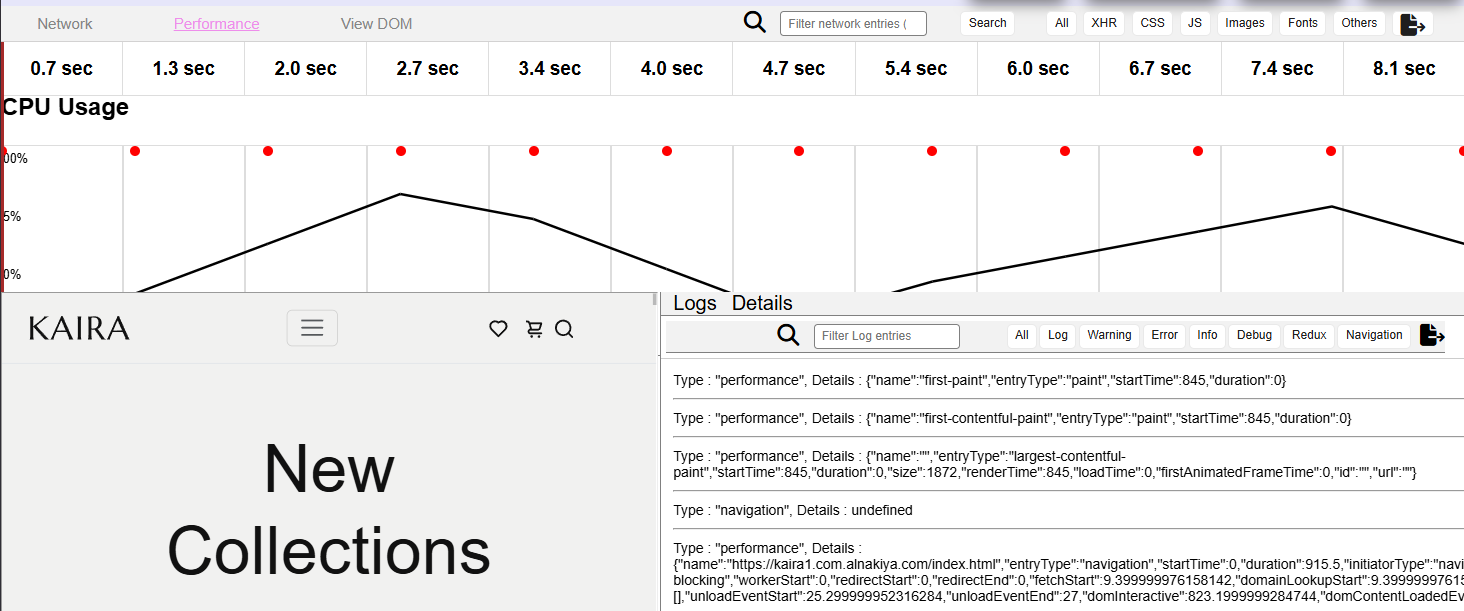
- CPU Usage:
Monitor CPU usage to detect periods of high demand that could affect the user experience. A high CPU load typically indicates inefficient JavaScript execution or unoptimized rendering.
- Key Benefit: Helps you understand which operations are taxing the CPU, allowing you to optimize heavy tasks.
- Actionable Insight: Optimize JavaScript execution, defer non-essential scripts, and reduce the frequency of heavy DOM updates.
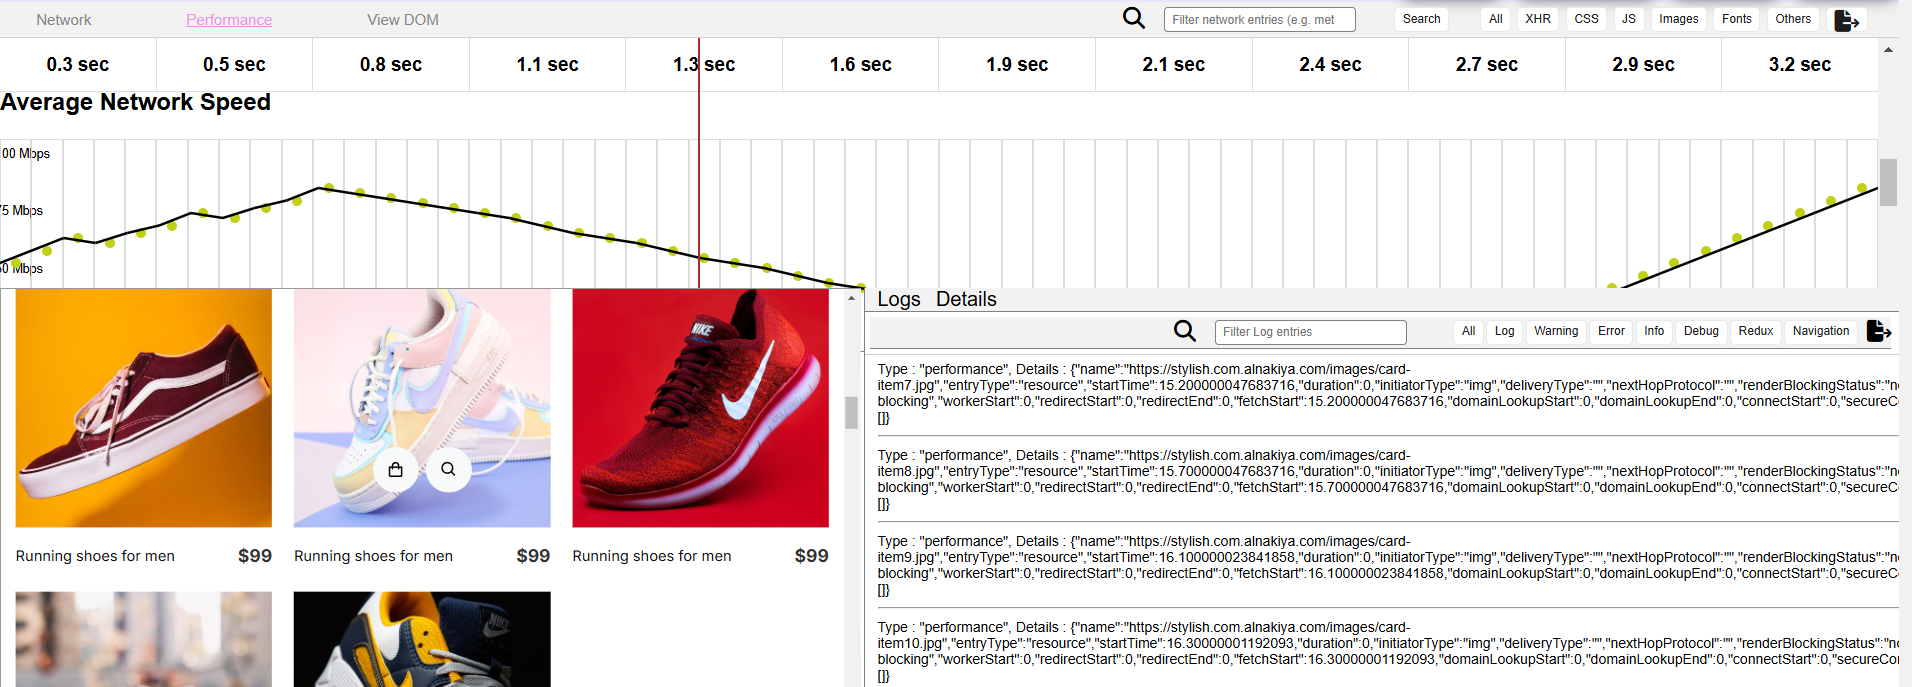
- Average Network Speed:
Measure the average network speed throughout the session. This metric is critical for understanding the delays caused by users' internet speeds, especially for those on mobile networks or slower connections.
- Key Benefit: Understand how network conditions affect the loading times and responsiveness of your application.
- Actionable Insight: Compress assets like images and videos, optimize your API requests, and reduce network latency to improve load times for users with slower connections.
- Long Tasks:
Identify long-running tasks that block the main thread, which could cause significant delays in the user interface. These tasks might be running complex JavaScript operations or rendering a large number of elements.
- Key Benefit: Allows you to break down complex tasks and improve responsiveness by ensuring they don’t block the main thread.
- Actionable Insight: Use web workers for offloading heavy computations and break tasks into smaller chunks to ensure the user interface remains responsive.
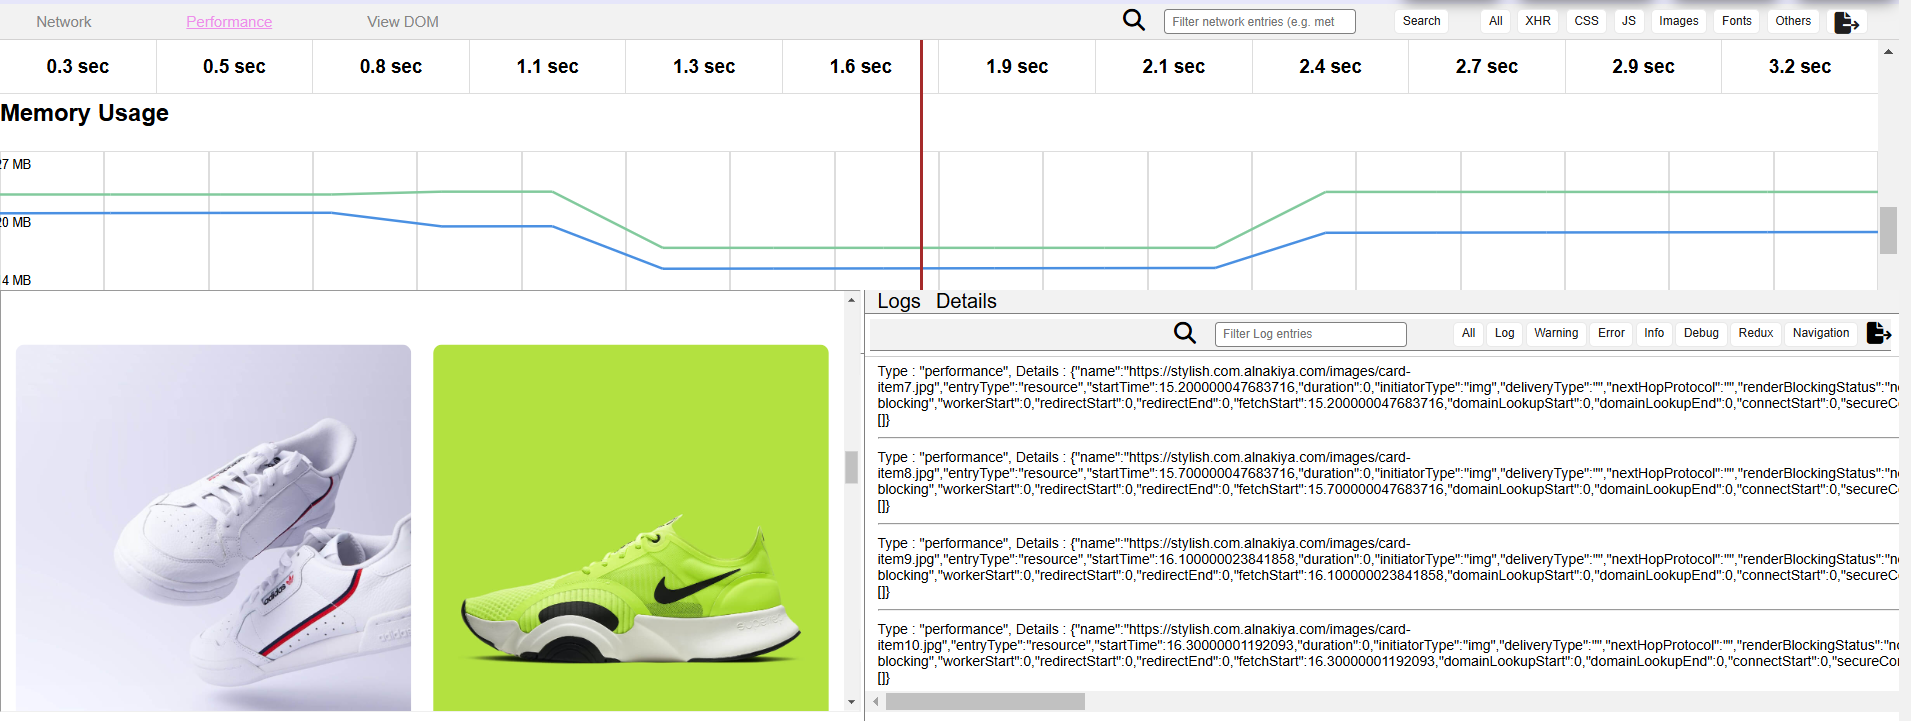
- Memory Usage:
Track memory consumption to detect potential memory leaks or excessive memory usage, which could slow down or even crash the application.
- Key Benefit: Helps identify inefficient memory use, which can lead to browser crashes or significant slowdowns.
- Actionable Insight: Monitor the heap memory usage, remove unnecessary objects from memory, and ensure proper garbage collection to prevent memory leaks.
- Cumulative Layout Shift (CLS):
Track layout shifts to measure how stable your page layout is during load. High CLS scores mean users are experiencing unexpected shifts in the layout, negatively affecting the experience.
- Key Benefit: Minimizes layout shifts that disrupt user interactions, improving user satisfaction.
- Actionable Insight: Ensure that images and videos have predefined size attributes and preload fonts to prevent unexpected layout shifts.
- Crashes:
View crash reports and critical errors that occurred during the session. This allows you to identify the root cause of crashes and implement timely fixes.
- Key Benefit: Quickly address critical issues that affect the user experience, leading to a more stable application.
- Actionable Insight: Use detailed crash logs to diagnose the issues and implement retries or alternative strategies for handling failures.
Session Sharing
Share session data easily with stakeholders or other developers by generating a shareable URL. This feature promotes efficient collaboration, especially for diagnosing bugs or improving performance.
Navigation to DOM View
Seamlessly navigate to the DOM View Page for a deeper inspection of the page structure and elements. This feature allows you to link performance insights with DOM analysis for a more complete debugging experience.
How to Use the Developers Tool Page
Review Network Information
Examine the network activity in detail. Look for requests that take longer than expected or failed resources. Optimizing network requests—such as reducing payload size, using CDN resources, or optimizing API calls—can dramatically improve performance.
Analyze Performance Metrics
Use the following performance metrics to enhance your application's performance:
- Page Load Timeline: Focus on the loading stages that take the longest and optimize server responses accordingly.
- CPU and Memory Usage: Track usage spikes to find inefficiencies in script execution and unnecessary memory consumption.
- Long Tasks: Break down long-running tasks into smaller, more manageable operations to prevent blocking the UI thread.
- Cumulative Layout Shift: Optimize layout to avoid visual jumps during page load, improving user experience.
- Crashes: Address crashes quickly to maintain a stable and functional application.
Sharing and Collaboration
Use the session sharing feature to generate a link. Share this link with teammates to collaboratively review the session data, troubleshoot issues, or analyze performance insights.
Navigate to DOM View Page
Leverage the DOM View Page to inspect how the DOM structure impacts the performance and functionality of your application. This integration ensures that you can review both front-end elements and backend performance together.
Best Practices
Focus on Long Tasks and CPU Usage
Reducing long tasks and optimizing CPU usage is critical for smooth performance. Break down large scripts, defer non-essential code, and monitor CPU spikes to prevent slowdowns.
Analyze Network Speed and Page Load Timeline
Identify slow-loading resources and optimize the load process. Cache assets, reduce network requests, and prioritize critical resources to improve page speed.
Monitor Crashes and Memory Usage
Regularly monitor memory usage and address memory leaks promptly. Also, review crash reports to identify recurring issues and improve the stability of your application.