Path Analysis
Track user paths to optimize navigation.
Overview of Path Analysis
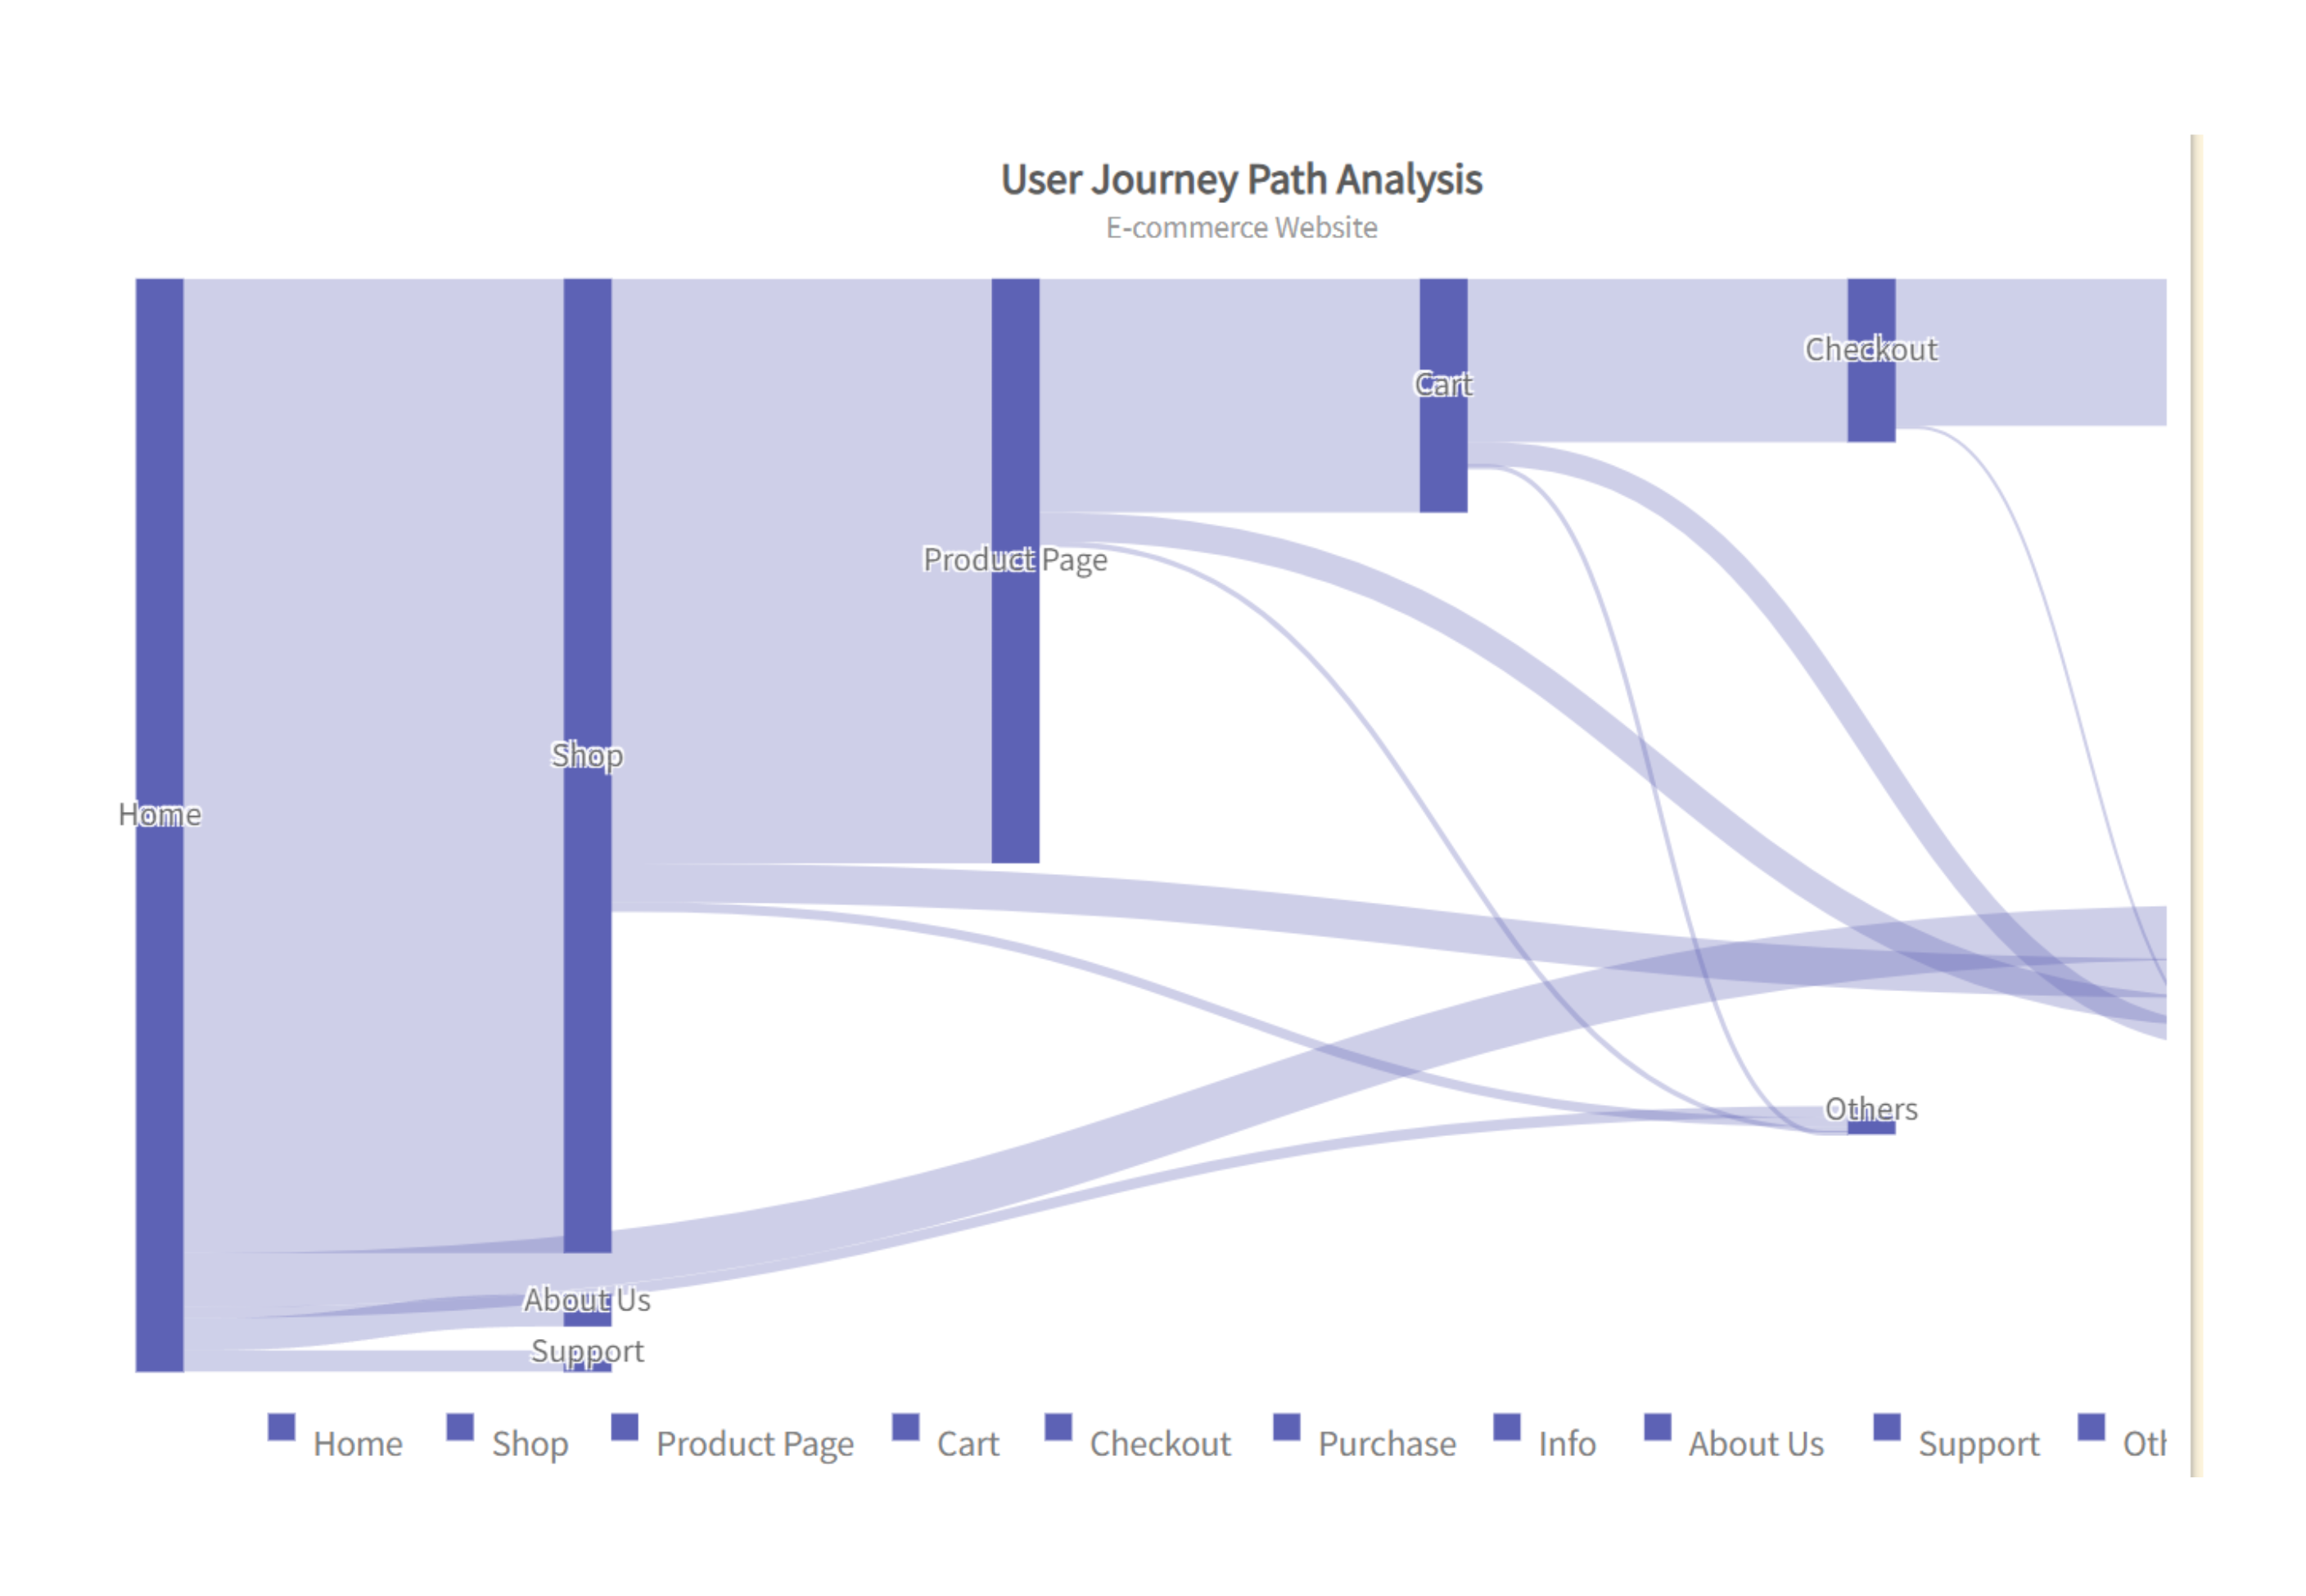
The Path Analysis functionality enables you to visualize and comprehend the navigation patterns of users on your website. By examining user journeys, you can pinpoint frequently traveled routes, areas where users disengage, and potential enhancements to improve your application's flow, ultimately leading to increased engagement and conversion rates.

Setting Up Path Analysis
Selecting Pages for Analysis
Use the From Page and To Page filters to specify the user journey you want to analyze:
- From Page: Choose the starting page where the user journey begins.
- To Page: Select the destination page to see how users navigate to it.
Once selected, the analysis will include paths that may traverse multiple intermediate pages between the start and end points.
Understanding the Path Visualization
The path visualization will display all possible routes users take from the selected From Page to the To Page:
- Navigation Percentages: Each path is labeled with the percentage of users who follow that route, giving you insight into the most common or significant user flows.
- High Percentage Paths: Paths with higher percentages indicate the most frequently traveled routes.
- Low Percentage Paths: Paths with lower percentages highlight less common paths.
Date and Time Range Filtering
By default, the Path Analysis page shows data from the last 30 days. Use the date and time filter to customize the time range and analyze user behavior over different periods. This can help you identify trends or changes in navigation patterns over time.
How to Use Path Analysis
Configure Filters
- Select the From Page and To Page to focus on specific user journeys.
- Adjust the date and time range as needed to analyze recent or historical navigation data.
Review Navigation Paths
Study the visual representation of paths and note which routes are most or least common. Identify potential drop-off points where users may be abandoning their journeys.
Insights from Path Analysis
Optimize High-Traffic Routes
Use the insights from frequently used paths to streamline popular user journeys, making them more efficient. For example, identify repetitive actions or redundant clicks and optimize the flow to reduce friction. Our **real-time conversion funnel analytics** provides immediate feedback on these adjustments, allowing for quick validation of improvements.
Interactive Tip: Use the "High-Traffic Insights" feature in your dashboard to visualize and prioritize these routes, enabling seamless optimizations for your most valuable user journeys.
Address Drop-Off Points
Analyze where users are leaving your site and consider improving content, layout, or call-to-action elements to keep users engaged. With our **video-style replays**, you can see exactly how users interact with your site before dropping off, giving you a clearer picture of issues that might not surface in aggregate data alone.
Case Study: One customer identified a critical drop-off point caused by a slow-loading payment page. By addressing the load time and refining the UI, the customer improved their conversion rate by 18%.
Tip: Leverage our debugging tools to identify and fix technical errors contributing to drop-offs, ensuring smoother user experiences.
Understand Intermediate Page Visits
Gain insights into which intermediate pages users visit before reaching their destination and assess their importance in the overall user experience. These pages often serve as stepping stones that either enhance or detract from the user's journey.
Our **sophisticated search functionalities** allow you to explore usage patterns for intermediate pages, ensuring that every step in the journey contributes to a seamless experience.
Actionable Insight: Use our digital experience analytics to rank intermediate pages by their impact on conversion rates, and consider redesigning or consolidating less impactful ones.
Explore Session Replays and Behavior Mapping
Session replays provide unparalleled insight into user behavior, letting you watch real-time video-style recordings of user interactions. These insights can be used to identify subtle usability issues, such as hard-to-find buttons or confusing navigation paths.
Pro Tip: Enable heatmaps on session replays to correlate visual interaction data with specific user actions, enhancing your ability to make informed design decisions.
Integrate with SaaS Solutions for Seamless Debugging
Our product integrates with prominent SaaS solutions, allowing you to centralize your analytics, debugging, and development workflows. From monitoring APIs to analyzing frontend performance, our tools ensure you have a 360-degree view of your digital ecosystem.
Example: By integrating with popular tools like Slack and Jira, you can instantly share insights and assign tasks to your team, streamlining the debugging and optimization processes.
Drive Results with Real-Time Conversion Funnels
Our **real-time conversion funnels** allow you to track the effectiveness of your efforts as they happen. Monitor live data streams to identify trends, respond to challenges, and seize opportunities immediately.
Dashboard Insight: Use the "Conversion Dashboard" to drill down into specific segments and measure the impact of changes on targeted user groups.