Introduction
Welcome to BehaviorCode Documentation! Your gateway to understanding and mastering user behavior analytics for optimizing your digital experiences.
Overview
BehaviorCode empowers you with cutting-edge tools to monitor, analyze, and optimize your users' digital experience. Our platform combines powerful analytics, session replay capabilities, error tracking, and performance monitoring to help you understand user behavior, identify issues, and enhance the functionality of your web applications. Designed for developers, product teams, and business owners, BehaviorCode is your partner in delivering seamless, user-friendly, and high-performance web experiences.
Whether you're troubleshooting bugs, analyzing user interactions, or optimizing conversion rates, our suite of tools provides actionable insights into your application. With BehaviorCode, you can ensure your website is not only functional but also delightful to use.
Key Features
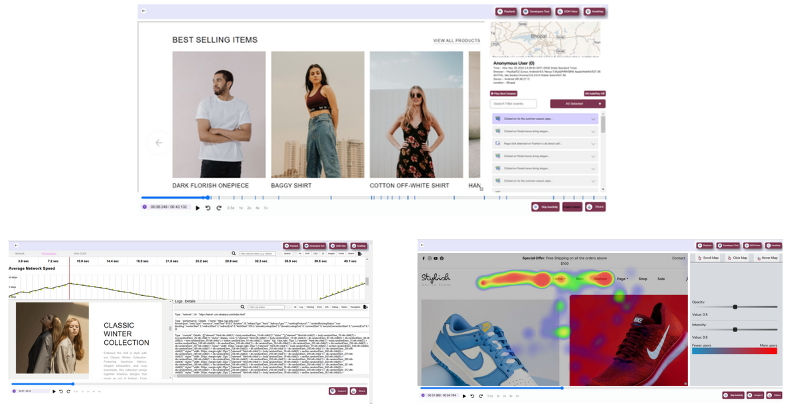
BehaviorCode offers a comprehensive suite of features designed to provide actionable insights into user behavior and website performance. Below, we explore the primary tools and functionalities that make BehaviorCode an essential addition to your analytics toolkit.
1. User Analytics
Understand user behavior at a granular level using advanced analytics tools.
- Heatmaps: Visualize where users click, scroll, and spend the most time.
- Behavior Trends: Identify patterns in user interactions over time.
- Segmentation: Analyze behavior across different user groups for targeted insights.
2. Session Replay
Relive user sessions with video-style playback to see exactly how users interacted with your application. Perfect for debugging issues, understanding user pain points, and improving overall user experience.
- Pixel-Perfect Replays: See every click, scroll, and form input in action.
- Rage Clicks & Errors: Automatically detect user frustration and technical errors.
- Data Privacy: Mask sensitive information to ensure user trust and regulatory compliance.
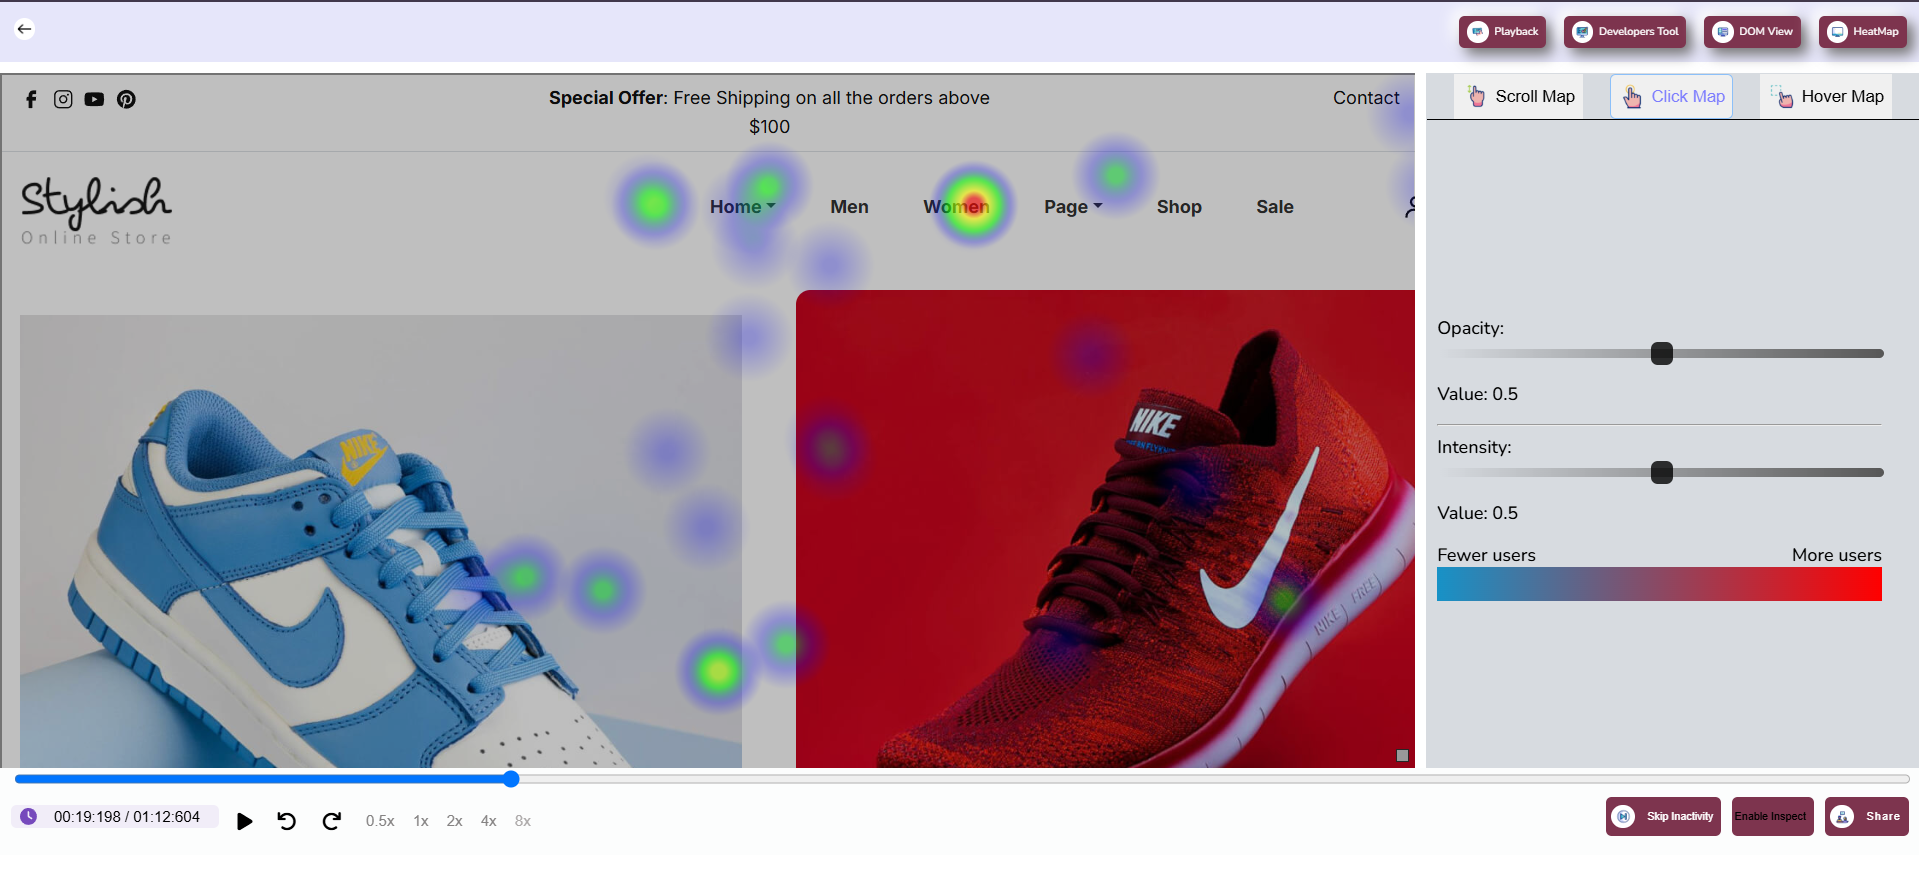
3. Heatmaps
Heatmaps provide a comprehensive visual representation of user engagement across your website. They allow you to analyze user interactions in detail, offering insights into how visitors navigate, engage, and interact with various elements on your pages. This data enables you to make informed decisions to optimize your website's design, layout, and overall user experience.
- Click Maps: Click maps highlight the areas on your website where users click the most. By identifying high-interaction zones, you can enhance navigation and improve the visibility of important elements like call-to-action buttons, links, and images.
- Scroll Maps: Scroll maps help you understand how far users scroll down a page. They reveal which sections of your content are being viewed and where users drop off. This information is crucial for adjusting content placement to maximize engagement and ensure key information is seen.
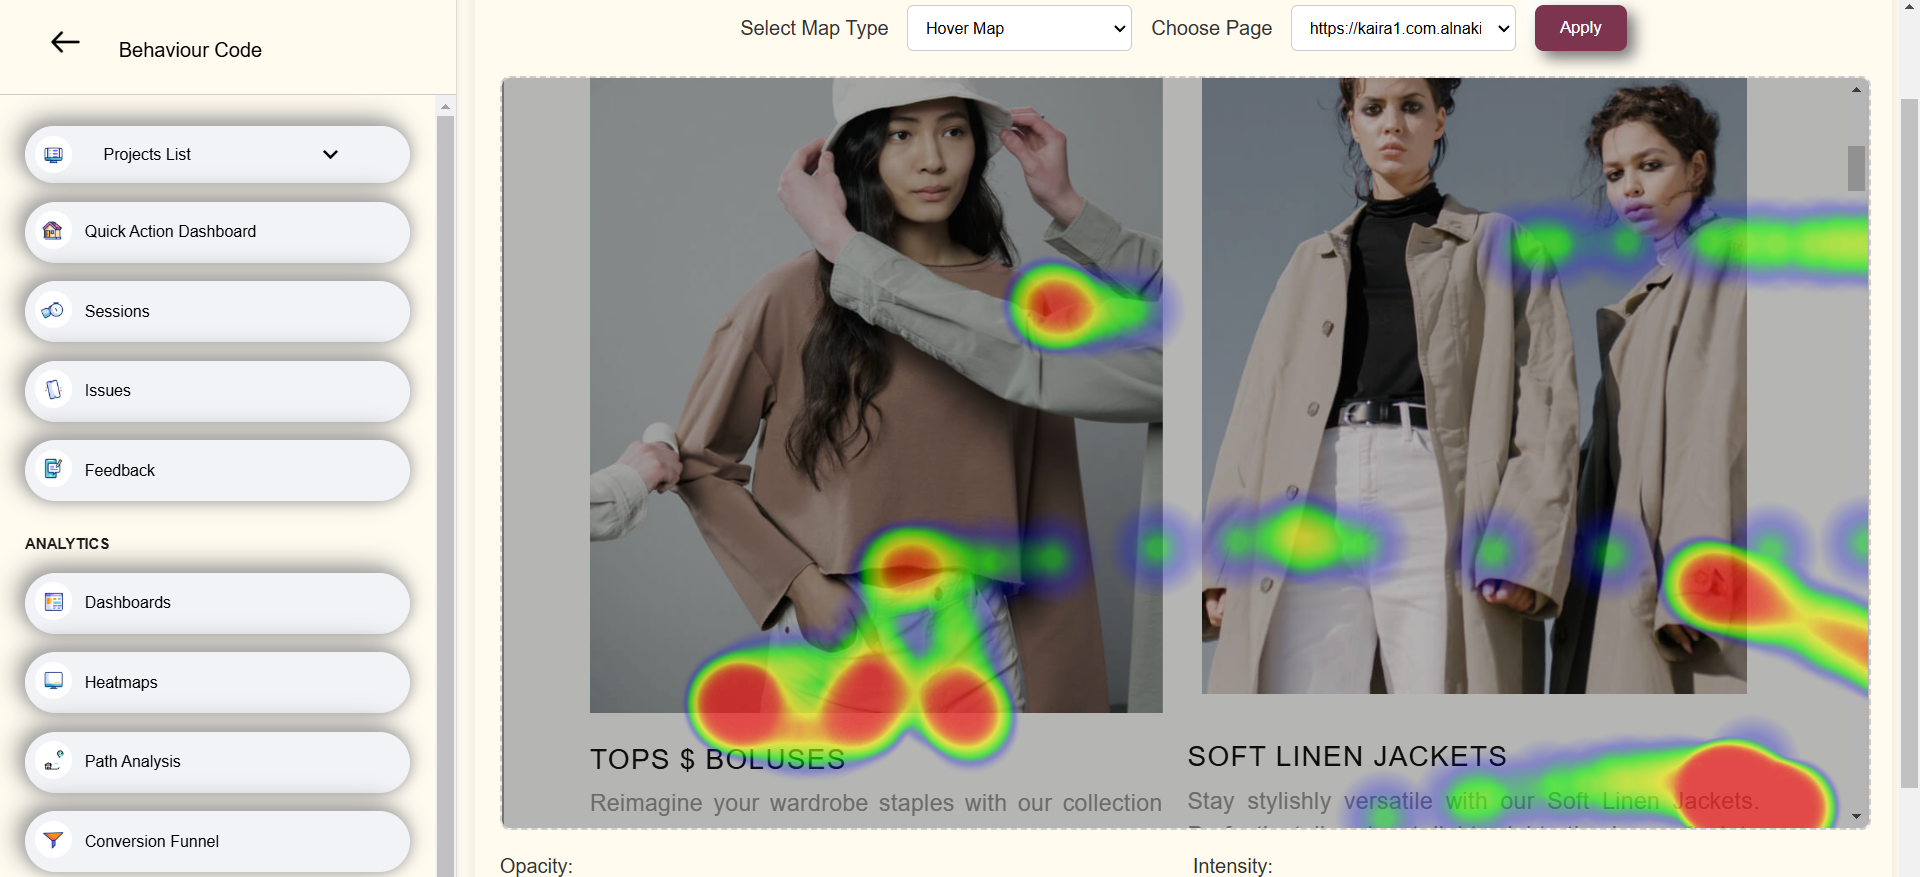
- Hover Maps: Hover maps track where users move their cursor on the screen, providing insights into areas of interest and hesitation. These maps are especially useful for understanding user intent and refining the design of interactive elements like menus, forms, and buttons.
- Engagement Analytics: Engagement analytics combine data from click maps, scroll maps, and hover maps to identify underutilized or overlooked areas of your website. By analyzing this data, you can redesign and restructure your website to better align with user behavior and preferences.
4. Conversion Funnels
Track and analyze the user journey through your conversion processes. Understand where users drop off and identify friction points to streamline their experience.
- Custom Funnels: Define specific paths to analyze key conversion metrics.
- Drop-Off Analysis: Identify where users abandon the process.
- Optimization Insights: Use data to reduce friction and improve completion rates.
5. Path Analysis
Discover the common pathways users take through your application. Path analysis helps you understand user navigation trends and highlights opportunities for improvement.
- User Journeys: Visualize how users explore your application.
- Key Navigation Patterns: Identify popular pathways and bottlenecks.
- Guided Optimization: Make data-driven decisions to refine the user journey.
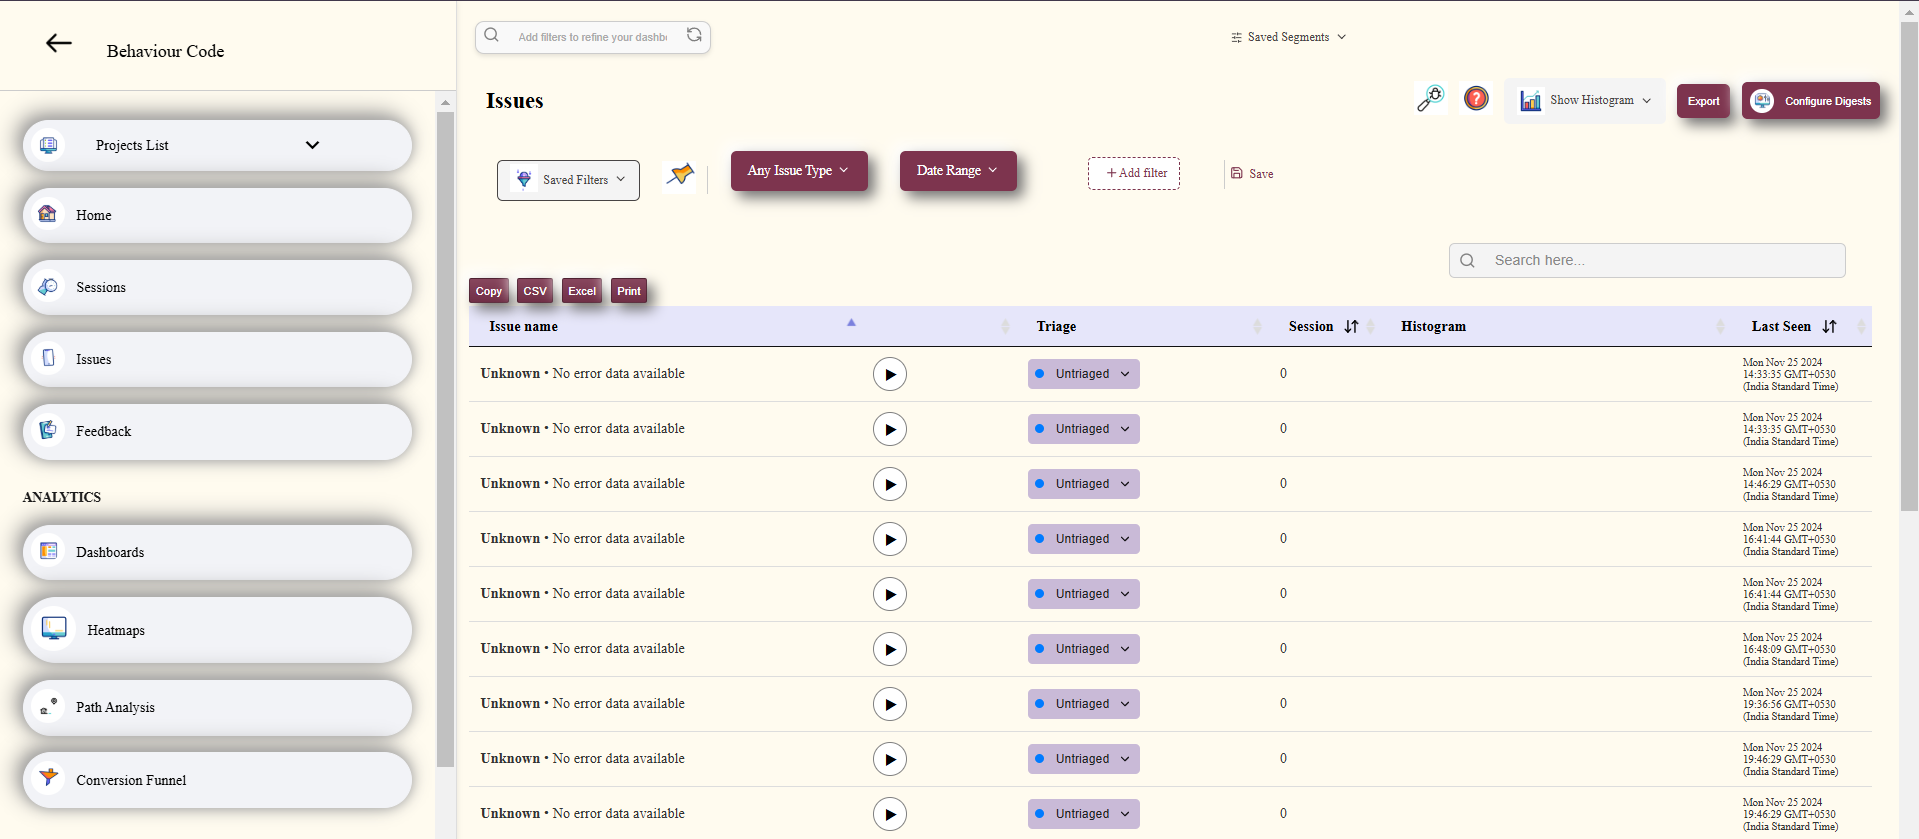
6. Error Tracking
Proactively address issues with real-time error detection and detailed diagnostics. Our error tracking system ensures you catch and resolve bugs before they impact users.
- Automatic Detection: Receive alerts for errors as they happen.
- Stack Traces: Diagnose the root cause of issues with comprehensive error logs.
- Error Categories: Group and prioritize errors for efficient resolution.
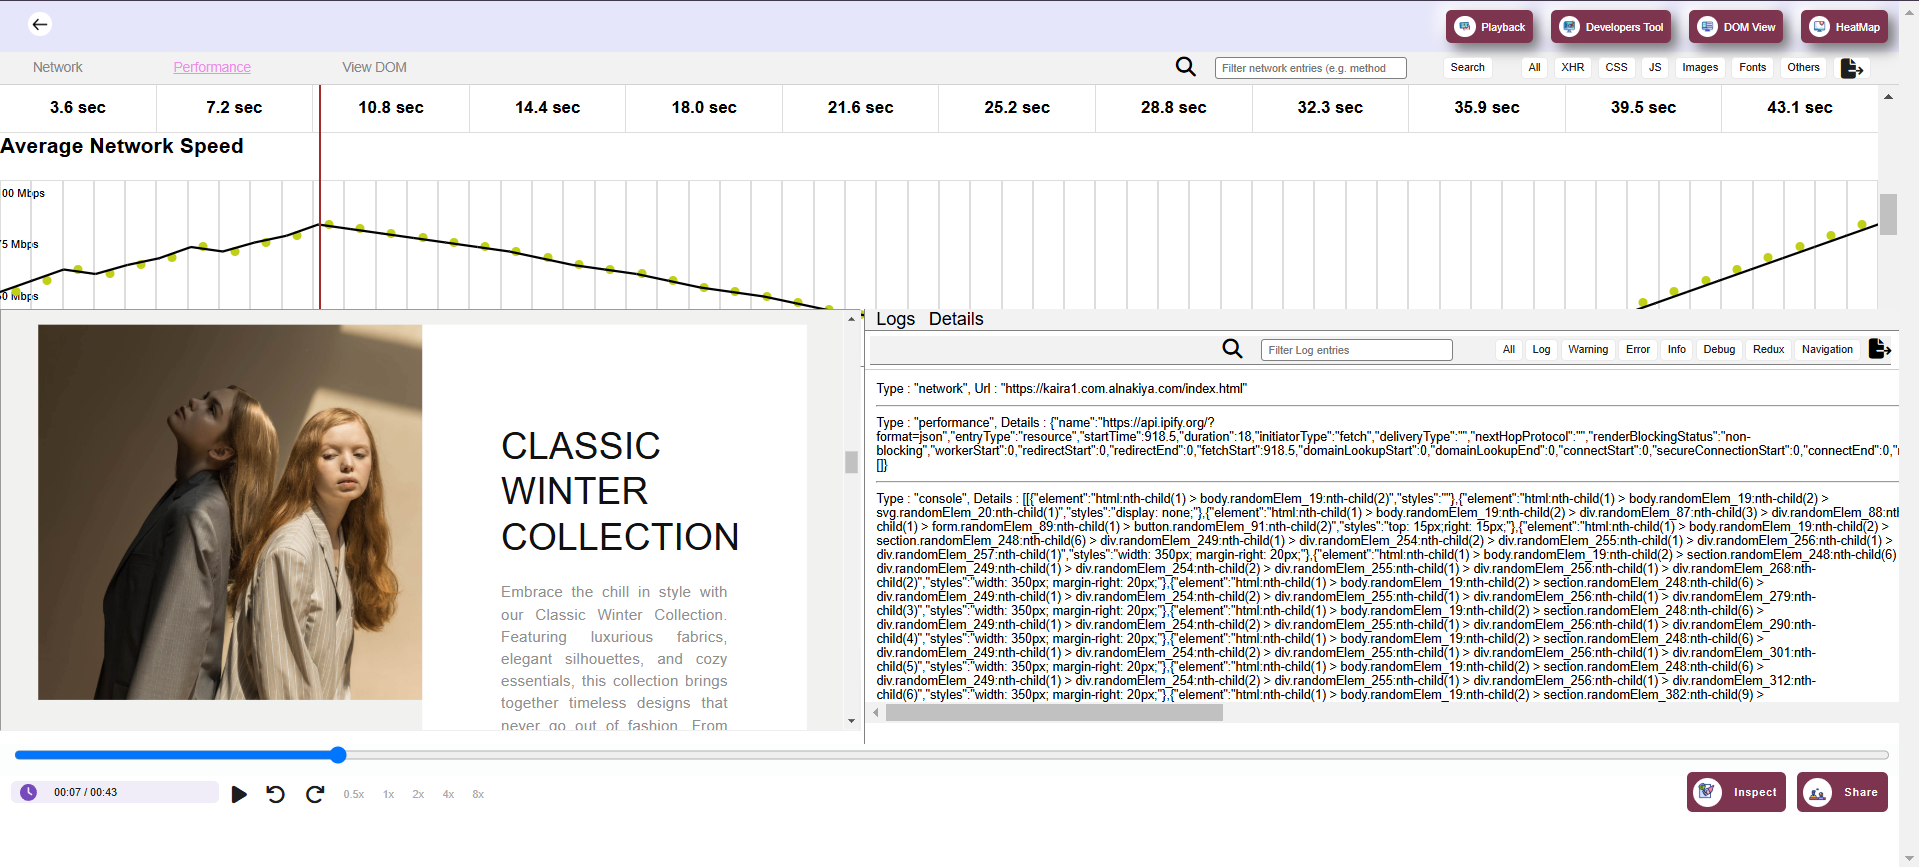
7. Performance Monitoring
Ensure your application runs efficiently with comprehensive real-time performance analytics. Monitor key performance indicators such as page load times, resource usage, and stability metrics to deliver a seamless user experience. This section provides actionable insights to improve application responsiveness and reliability.
- Page Load Timeline: Visualize and analyze the loading sequence of your application, from initial server response to complete page rendering.
- CPU and Memory Usage: Track resource utilization to identify bottlenecks and optimize application performance.
- Long Tasks: Detect and address tasks that block the main thread for an extended period, improving interactivity and responsiveness.
- Cumulative Layout Shift (CLS): Measure and reduce layout shifts to enhance visual stability and user satisfaction.
- Crashes: Automatically detect application crashes and access detailed reports to pinpoint and resolve issues quickly.
Why Use BehaviorCode?
- Enhanced User Experience: Identify and resolve friction points to create seamless interactions.
- Data-Driven Decisions: Leverage insights to improve design, functionality, and performance.
- Boost Conversion Rates: Understand the user journey to optimize critical processes.
- Proactive Debugging: Address errors before they affect your users.
- Comprehensive Insights: Gain a holistic view of application performance and user behavior.